What is it?
SVG:::Graph is a pure Ruby library for generating charts, which are a type of graph where the values of one axis are not scalar. SVG::Graph has a verry similar API to the Perl library SVG::TT::Graph, and the resulting charts also look the same. This isn't surprising, because SVG::Graph started as a loose port of SVG::TT::Graph, although the internal code no longer resembles the Perl original at all.
SVG::Graph isn't only for charts. With version 0.4.0, support for Plot charts was added, so scalar data may now be charted.
What's new?
You can find that out in the change log.
Screenshot
Gotta have one.
Here's a PNG version of the above image for the SVG-challenged:
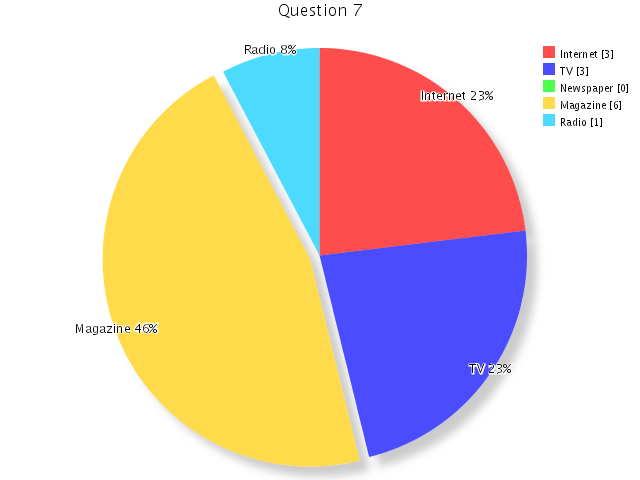
The SVG version is much cooler. More screenshots are available.
Why use it?
If you're a Ruby programmer, you can't use SVG::TT::Graph directly. This package is for you.
If you want one of the features that this package has that the Perl version doesn't, and you don't mind doing your graph code in Ruby, then this package is for you.
If you want to generate SVGs that aren't CSS styled (and work with more SVG renderers), use this package.
If you're a Perl wienie or you have something against Ruby, use SVG::TT::Graph. If it doesn't provide you with the features you want, hack it yourself.
Getting it
The source archives contain the example script(s) and an install script. Documentation must be downloaded separately.
Why?
The SVG::TT:Graph package is just fine. It lacked a couple of features that I wanted, and it was in Perl1, so I re-implemented it.
SVG::Graph is not a straight port of SVG::TT::Graph, because the Perl version uses templates, and I don't believe that this is a job for templates. Templates are great when you have lots of context containing a little bit of evaluated code, but the Graph classes are mostly code with a little SVG; therefore, it makes more sense (and is a hell of a lot more readable) to have the SVG embedded in the code rather than vice versa. However, some of the logic was directly cut and paste out of SVG::TT::Graph, as was the entire CSS code and chunks of the documentation, and the part of the API that the user sees is almost identical to the original.
In version 0.2.0 I completely refactored the code to make it more modular. As a result, the core Graph class contains most of the graph drawing primatives, and the specializations (Bar, BarHorizontal, Line, Pie, etc.) only draw the plot itself. This results in many fewer lines of code, and that code is more robust. SVG::TT::Graph re-implemented most of the code for every plot type, whereas SVG::Graph reuses most of the code.
I intend SVG::Graph to have more features than SVG::TT::Graph, which is the main reason for the re-implementation. One such feature is the ability to change the stacking of the data sets. For instance, SVG::Graph allows you to place the data bars from multiple data sets on the same graph side-by-side, rather than overlapping.
SVG::Graph also has an option to disable CSS styling of the graphs. This has a number of consequences, both positive and negative. The SVGs generated can be larger without CSS, and they are harder to dynamically style (you can't use your own styles with CSS disabled). However, a number of SVG renderers do not support or do not fully support CSS in SVG (KSVG in Konqueror and librsvg, for instance). Adobe and Batik both support CSS, so if those are your targets, you can use CSS. For maximum compatability, disable CSS with the :no_css attriibute.
The currently supported graph types are:
-
Bar
-
BarHorizontal
-
Line
-
Pie
-
Plot (this is scalar data)
-
TimeSeries (also scalar data, with one axis being dates)
-
Schedule (scalar time range data, with non-scalar Y axis)
Dependancies
REXML 3.0+, or Ruby 1.8+. If you want to use the SVG compression feature, which generates zlib compressed SVGs, you must also have the Ruby zlib library installed.
Notes
SVG feature support
Some SVG renderers (librsvg) do not understand CSS. This is a problem with Perl's SVG::TT::Graph, because all of the styling of the charts it generates is done with CSS. SVG::Graph is able to inline the styles, rendering graphs that are compatible with more viewers.
The Pie chart uses the feGaussianBlur filter to generate the shadow, whiich is also unsupperted by some renderers (librsvg). The shadow will not look as smooth on those displays, although it will render.
Sizes
The bar charts PNGs tend to be smaller than the uncompressed SVGs. In the best case (for PNG), the PNG is 66% of the size of the uncompressed SVG.
For line and pie charts, which are a little more visually complex, the SVGs are smaller than the PNGs. In the best case, the PNG is 130% the size of the SVG. In the worst case, the PNG is 220% the size of the uncompressed SVG.
The compressed SVGs are always much smaller than the PNGs. In the best case (a vertical bar chart), the PNG is 4.4 times the size of the compressed SVG, and in the worst case (for a pie chart), it is over 12 times the size of the compressed SVG.
These values were measured with inline styled SVGs, and the PNGs were reduced to 8-bit, indexed images, and were crushed with pngcrush.
Bugs
SVG::Graph probably contains bugs. In fact, it is probably mostly bugs, held together with some working code around them. In particular, SVG::Graph is probably really intolerant of *your* bugs, and is likely entirely unhelpful in helping you track down problems. We can only pray that this situation improves2.
There is a bug and feature request database; use this, and please create a user account if you don't have one, so that I can email you if I have questions. Alternatively, post anonymously, and check the database often.
Repository
The sourcecode repository is a Subversion repository, located here.